Heart Rate Sensing
How a Heart Rate Sensor Works
Cars have to stop at a stoplight when the light turns red, and continue moving when the light turns green again. The change in color of the lights is an indicator of a new period.
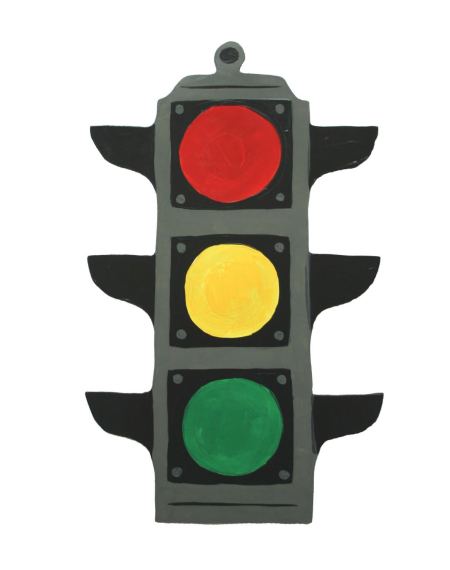
A heart rate sensor measures periods of time between each heartbeat. It also uses the indicator of color change to do this. Blood travels through the body in one direction away from the heart full of oxygen and then travels back without oxygen to collect more, cycling through the body in this way. The oxygenated (arterial) and deoxygenated (venous) blood cells have slightly different optical (react differently to light) properties which heart rate sensors can detect. With every heartbeat, there is a spike in oxygenated blood being pushed through the body. This makes a change in how much red/infrared light the sensor can detect, and how much is scattered through the blood.
Note: blood is always red, just different shades (bright red when oxygenated, dark red when deoxygenated).
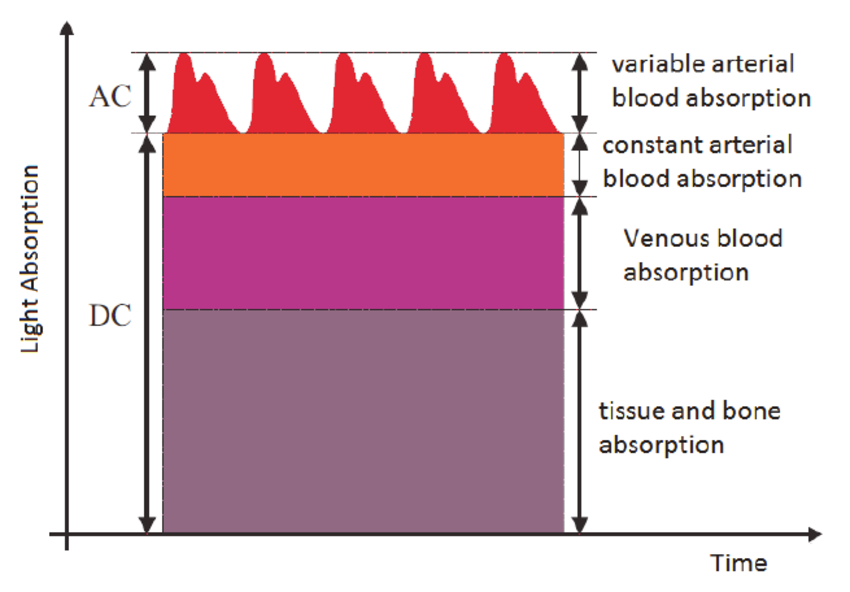
Photoplethysmography (PPG):
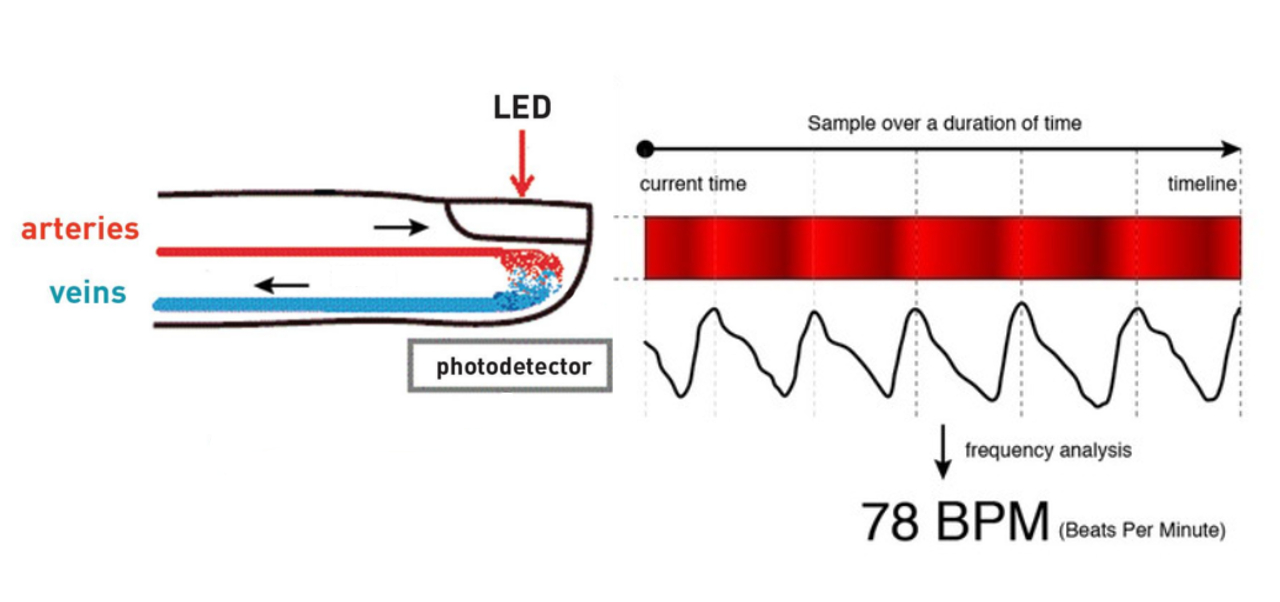
This method of pulse detection, sometimes called “optical” detection uses an LED (sometimes infrared) and a photodiode to detect the minute change in blood color that happens as a result of each heart beat. The LED shines through the skin, illuminating the blood vessels in the finger, or any other part of the body to which it is applied. When the heart beats, the amount of light reflected back to the photodiode changes, and the microcontroller wired to the sensor translates the signal from the photodiode into a waveform that can be graphed and analyzed.
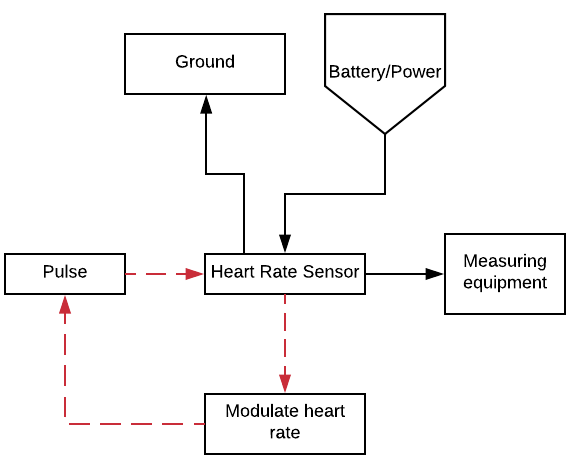
We can apply our systems perspective to this circuit to help us understand and design it. The system below represents the circuit described. The main sensing circuit consists of power, the heart rate sensor, to ground. The measuring equipment (Arduino) collects input information from the heart rate sensor in the form of voltage changes and the code will convert it into a form that will display onto your screen.
Pulse Sensor:
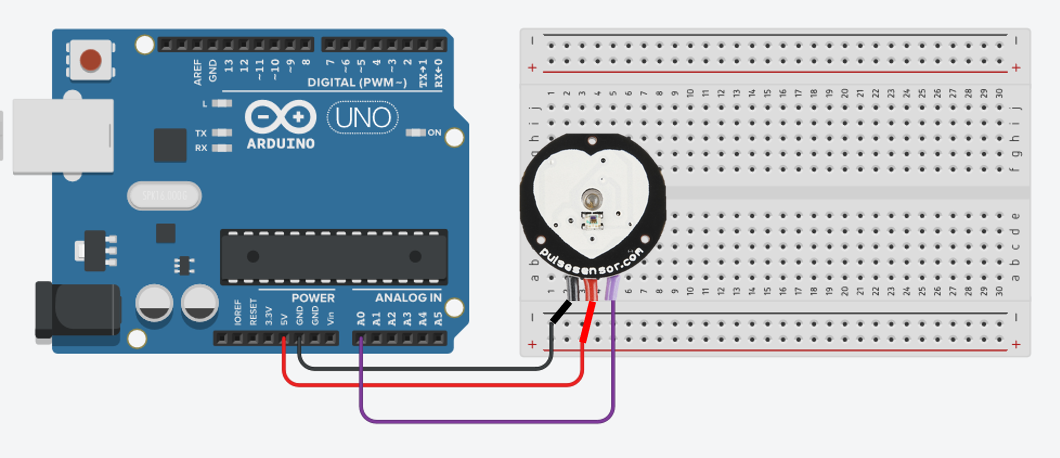
The three prongs have different colored wires connected to them. Wire colors are important to help people follow circuits. Red connects to power, black to ground, and other colors (in this case purple) to other parts in a circuit. Look at your arduino. Find the 5V power, ground pin, and inputs. In this case we are using the analog pins, or A0-A5. Look at the code to figure out which pin you should connect the purple wire to.
This is what your Pulse Sensor should look like:
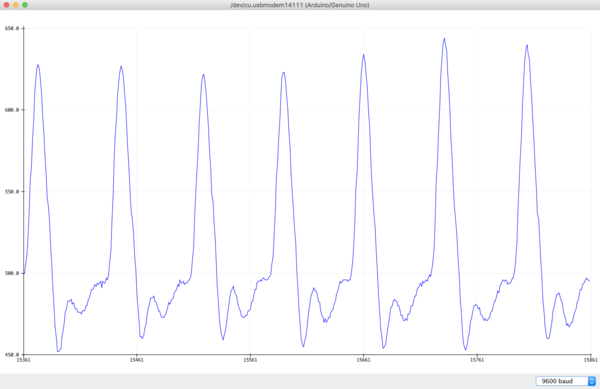
The output in the Arduino serial plotter will look something like this:
Electrocardiography (ECG or EKG):
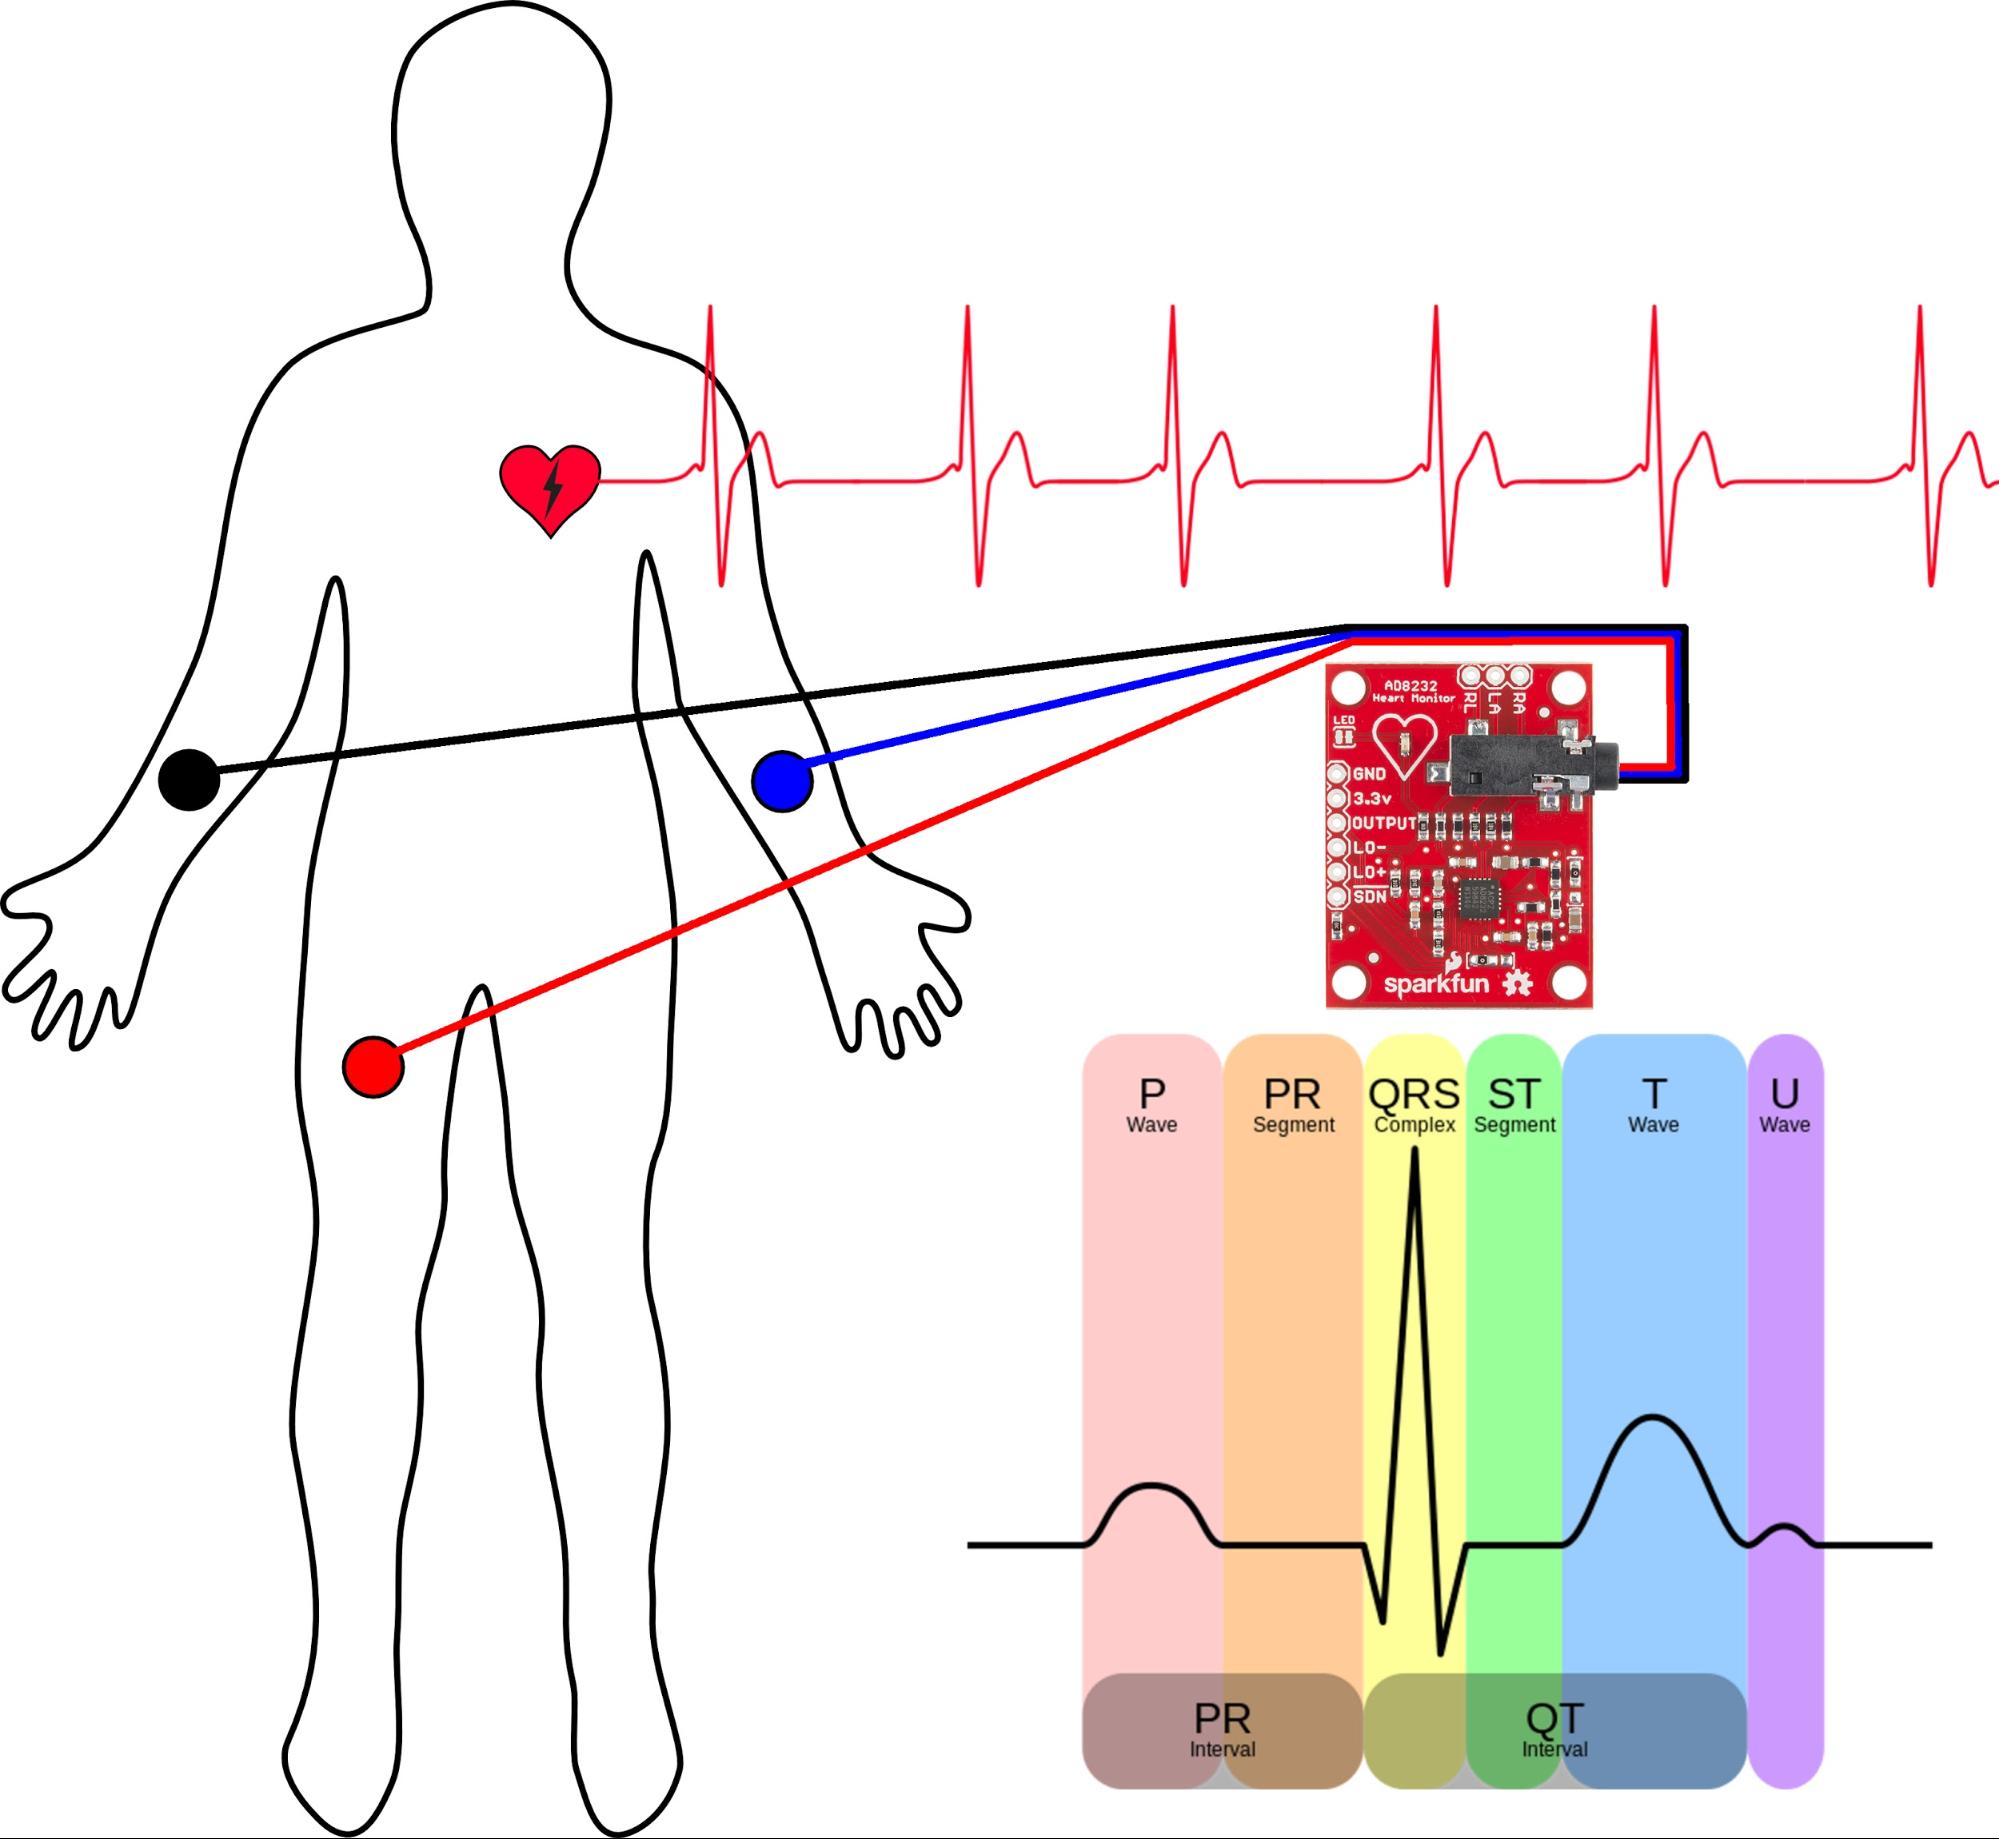
This pulse detection method uses adhesive conductive electrodes attached to the skin to detect the small electrical impulses that the heart creates every time it beats. By examining the pulses over time, a medical professional can monitor heart rate as well as diagnose certain heart conditions. ECG data can also be used to determine physical properties of the body such as the size and position of the different chambers of the heart.
Choosing the Right Sensor
|
Photoplethysmography (PPG) |
Electrocardiography (ECG) |
|
|
Pros |
-Inexpensive -Only one sensor needed |
-Waveform is easily graphed -Very accurate |
|
Cons |
-Difficult to analyze waveform -Subject must remain still |
-Wires can become tangled -Subject must remain still |
When choosing a device to measure a subject's heart rate, either PPG or ECG can be used to a fair degree of accuracy if the subject remains still. When looking for the precise waveform of a heartbeat, ECG is the best technique. If only the beats per minute (BPM) is going to be recorded, PPG is great, because it is simple and only requires one connection to the body, as opposed to three.
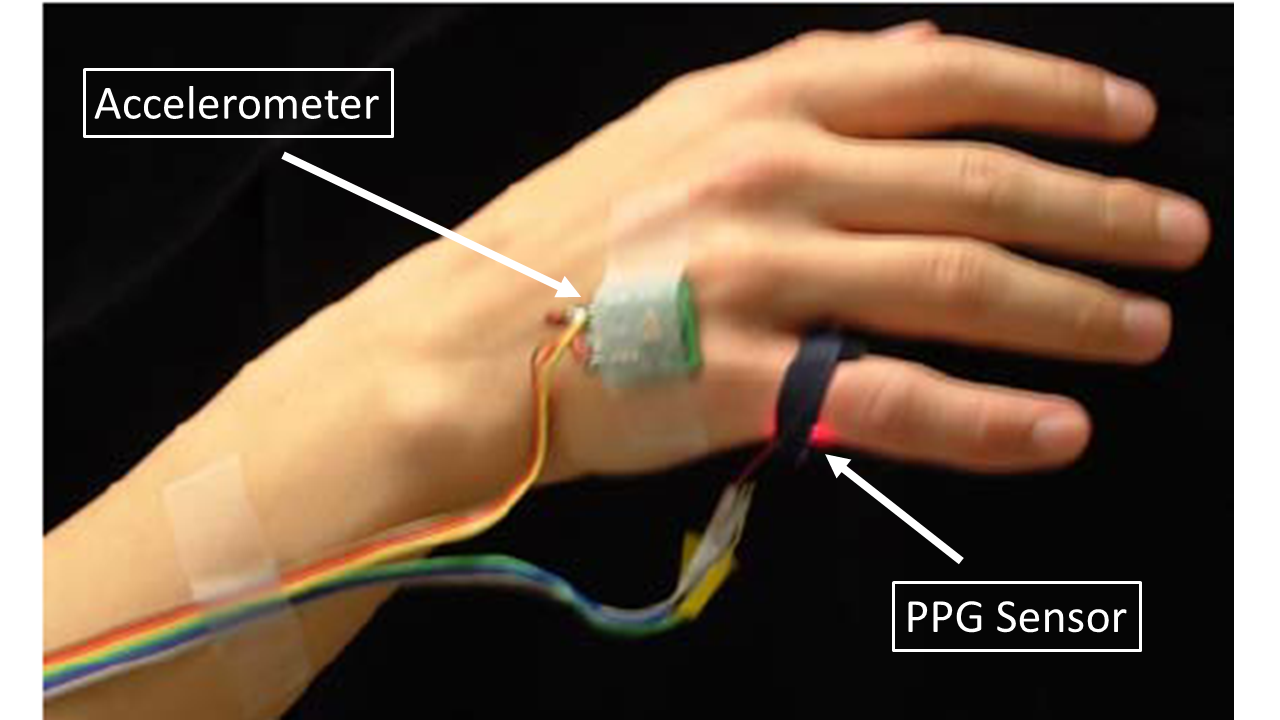
Some fitness heart rate sensors work while the subject is exercising.
Many companies sell portable athletic heart rate monitors that allow a jogger, swimmer, or biker to keep track of their heart rate on-the-go. These devices use an accelerometer in conjunction with a PPG or ECG sensor to account for the body's motion.