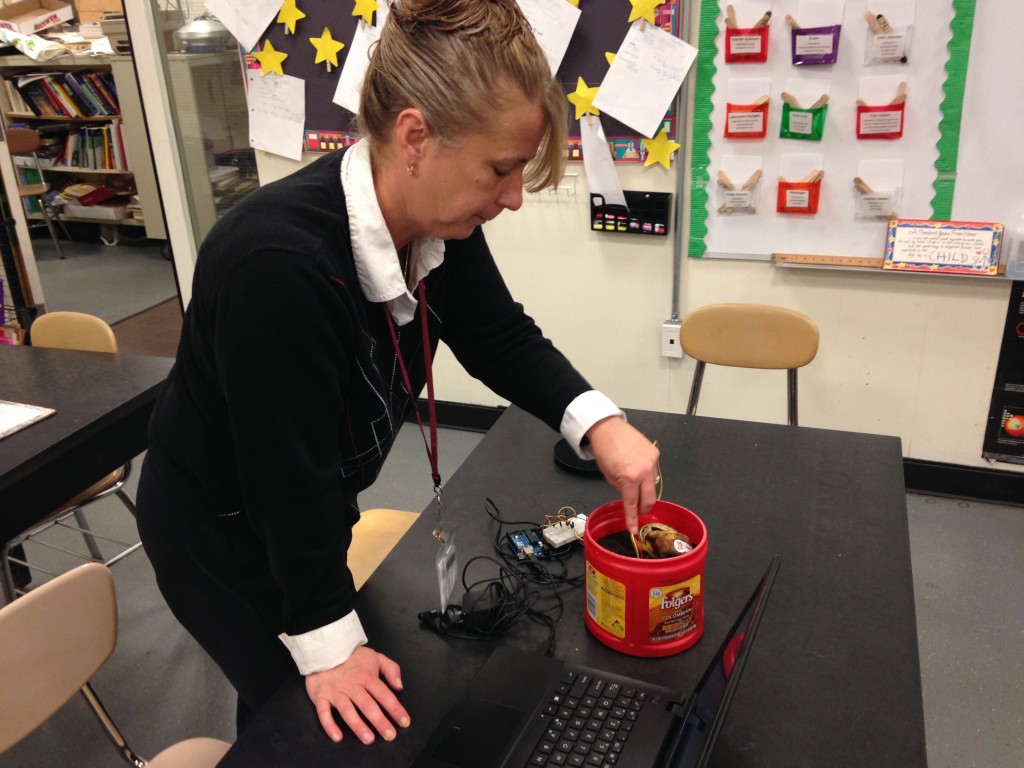
Composting Sensor
Composting is one of the main applications for a temperature and humidity sensor, which allows you to monitor the variables in a compost pile. There are also a number of other factors that can be monitored. The most important are gas ratio, temperature, moisture, and pH. The two gases that need to be monitored are carbon and nitrogen, with a desired ratio of 30:1 Carbon: Nitrogen. This ratio could be measured with a gas sensor. Temperature and humidity are measured with the HTU21D sensor. The ideal moisture level is between 40-60% humidity. If moisture is too low there will be no growth, but if it is too high there will be anaerobic bacteria and it will smell. The optimal temperature is between 40-50°C, which is easily measured with a sensor or standard thermometer. PH is a measure of the soil's acidity and it is important to keep it close to neutral (7) by maintaining a pH between 6 and 8. PH can be measured with a sensor but it involves taking a sample on a pH strip then reading it with a spectrometer to determine the color. An electronic pH sensor can be used, but it has a high cost (and an approximate reading can be easily achieved with test strips for cheaper). These range values should be used as a basic guide and starting point in composting. Achieving the optimal balance ultimately depends on the environment and type of biomaterial in the pile, so some experimentation will be needed with each compost mix.
Key Factors in Compost
- Carbon to Nitrogen Ratio: 30:1 C/N
- Time: 6-24 months
- Moisture: 40-60% (at low now growth, at high anaerobic, smells)
- Temperature: 40-50 C
- pH: 6-8
- Odor: odors can indicate a variety of different types of bacteria growing.
Building the Sensor
Materials
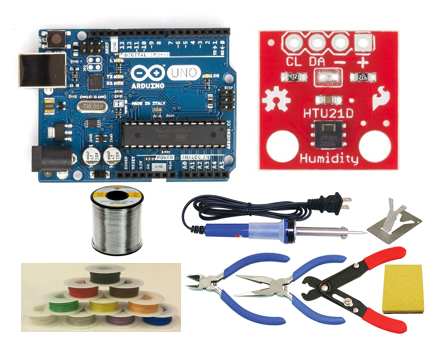
Arduino:
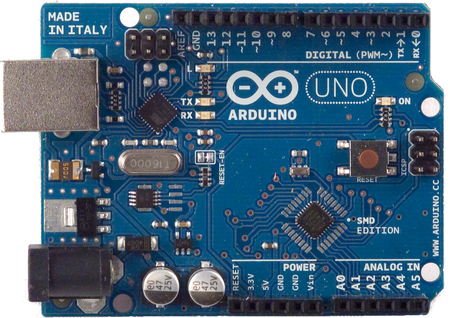 Arduinos are cheap and easy-to-use microcontrollers. They have a small amount of processing
power, and can be used to send different signals across different pins, which can be in turn connected to a wide
selection of sensors, switches, LEDs, etc. There are several different types of pins that can be utilized on the
board. The most important are the power and ground pins. The power pins allow the user to give a steady supply of
power at either 5V or 3.3V., to any part of the circuit. The ground pins allow any part of the circuit to be grounded,
thus completing the circuit. The next set of pins is Analog, and these can be used to input or output an analog
signal. These are useful when working with sensors that give a binary or hexadecimal readout. The last set of pins is
Digital. They are the opposite of Analog pins, and allow a digital signal to be either inputted or outputted.
Arduinos are cheap and easy-to-use microcontrollers. They have a small amount of processing
power, and can be used to send different signals across different pins, which can be in turn connected to a wide
selection of sensors, switches, LEDs, etc. There are several different types of pins that can be utilized on the
board. The most important are the power and ground pins. The power pins allow the user to give a steady supply of
power at either 5V or 3.3V., to any part of the circuit. The ground pins allow any part of the circuit to be grounded,
thus completing the circuit. The next set of pins is Analog, and these can be used to input or output an analog
signal. These are useful when working with sensors that give a binary or hexadecimal readout. The last set of pins is
Digital. They are the opposite of Analog pins, and allow a digital signal to be either inputted or outputted.
There are also several pins within the Digital pin section that have the ability to output a PWM signal. PWM stands for pulse width modulation, and alternates the power on-off cycle of the pin at an extremely fast rate. The amount of time the power is on is changed relative to the amount of time the power is off. This can be used for several different things, mainly fading LEDs and giving the proper pulsewidth signal to a motor or servo to change speed or position, respectively.
HTU21D Humidity and Temperature Sensor:
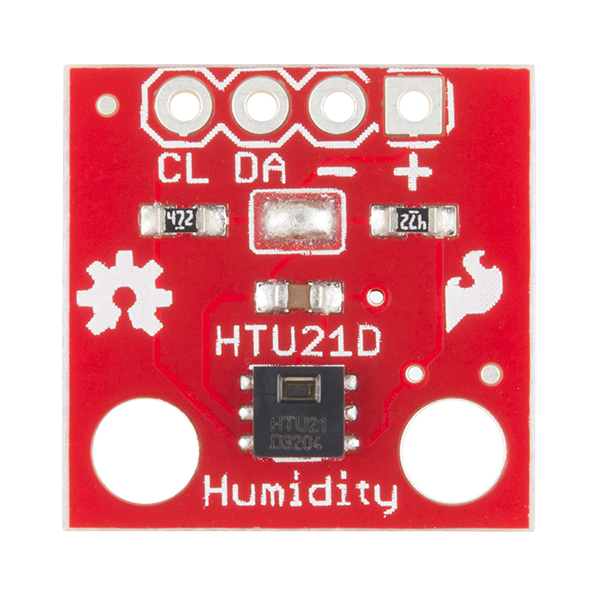
The HTU21D sensor has the ability to read temperature and humidity. There are four pins on the sensor chip – a power line (3.3V input), ground, SDA (Serial Data Line), and SCL (Serial Clock Line). SDA is used by the arduino to read data off the sensor. Reading the sensor uses I2C, and allows the microcontroller on the Arduino to read data from different addresses on the sensor. These different addresses correspond to the different values that can be read from the sensor – namely temperature and humidity. SCL, on the other hand, is used to synchronize the system clock for the microcontroller with the clock in the sensor. They are both set to 9600 baud. This makes sure that the microcontroller and the sensor operate at the same frequency.
Adafruit SD Card Arduino Shield:
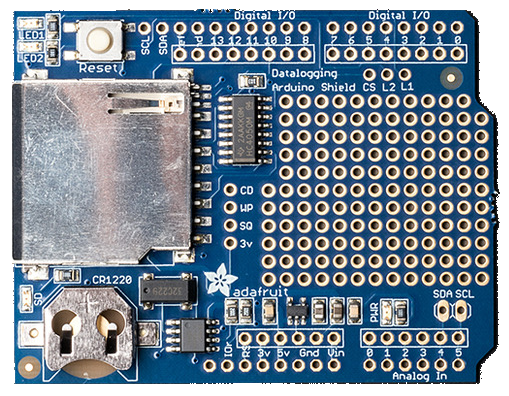
This shield allows users to log temperature and humidity indefinitely, assuming there is enough space on the SD card and there is a constant source of power. The assembly with the Arduino is very easy, and requires very basic soldering knowledge. The only thing necessary before use is to solder on header pins. After that, it can simply be plugged in on top of the Arduino. The SD card can be removed at any time and plugged into a computer to view the data logs. The data is outputted in the form of a text file, where each line is each printed Serial line from the Serial Output Window.
The shield itself provides all the necessary connections to the Arduino, while still allowing all of the pins to be used. By adding headers to the shield, the pins can be extended through it and become usable again, above the shield. Plugging in the SD card is as simple as that – once the card is plugged in, the board will automatically recognize it, and the SD card integration code can be used to log data. If there is no SD card in the slot, however, the SD card integration code will not be able to run.
Additional Sensors
Sensors can be added to monitor variables such as gas (methane), air quality (carbon monoxide), pH and a number of other variables.
Currently the arduino is exposed and cannot be left in an exposed environment. This can easily be fixed by adding on a case with a hole for the wires and a battery pack that can easily be attached to the arduino. An alternative to a battery pack could be a solar panel. The case can either be built or purchased and prevents the arduino from shorting. An alternative solution is to leave the arduino inside and run longer wires into the garden.
Build your own case: http://tinyurl.com/q9hju6r
HTU21D Arduino Schematic
The power pin on the HTU21D is connected to the 3.3V pin on the Arduino, and ground is connected to the ground pin. SDA is connected to Analog Pin 4, and SCL is connected to Analog Pin 5.
Method to wire circuits
- Cut equal lengths of each color wire. The length is whatever you desire based on the application. Ideally you want to keep the Arduino Uno out of the elements, we recommend about a foot.
- Strip ends of the wire ¼ in
- Tin the ends of the wire by heating it with the soldering iron then coating it with a thin layer of solder
- Heat the the surface on the sensor and wire with soldering iron and apply solder to the join. Soldering iron can be cleaned by wiping on wet sponge to remove excess solder
- Insert the wire into the appropriate slot according to the circuit diagram
- Wrap any wire with exposed wire and/or solder in electrical tape to prevent shorting
Programming Arduino
- Download and install Arduino software onto computer http://arduino.cc/en/main/software
- Load code (With SD Card or Without SD Card)
- Click to compile and verify code

-
Plug in Arduino with the micro USB cable and click the upload button

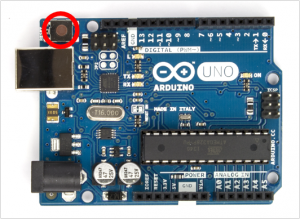
-
Hit the reset button on your Arduino (Circled in red)
- Congratulations! You can now run the sensor
Code (Integration with SD card data collection)
/*
HTU21D Humidity Sensor
Open serial monitor at 9600 baud to see readings. Errors 998 if not sensor is detected. Error 999 if CRC is bad.
Hardware Connections (Breakoutboard to Arduino):
-VCC = 3.3V
-GND = GND
-SDA = A4
-SCL = A5
*/
#include <Wire.h>
#include <SD.h>
#include “HTU21D.h”
const int chipSelect = 10;
int time = 1;
int outputpin= 0;
HTU21D myHumidity;
void setup()
{
Serial.begin(9600);
Serial.print(“Initializing SD card…”);
pinMode(10, OUTPUT);
if (!SD.begin(chipSelect)) {
Serial.println(“Card failed, or not present.”);
// don’t do anything more:
return;
}
Serial.println(“Card initialized.\r\n\r\n”);
Serial.println(“HTU21D Reading START”);
myHumidity.begin();
}
void loop()
{
float humd = myHumidity.readHumidity();
float temp = myHumidity.readTemperature();
//USE ONE OF THE FOLLOWING LINES TO CALIBRATE THE TEMPERATURE
//temp += __
//temp -= __
Serial.print(“Time: “);
Serial.print(millis());
Serial.print(“\r\nTemperature: \r\n Celsius: “);
Serial.print(temp, 1);
Serial.print(“C”);
float fahrenheit = ((temp * 9)/5 +32);
Serial.print(“\r\n Fahrenheit: “);
Serial.print(fahrenheit, 1);
Serial.print(“F\r\n”);
Serial.print(“Humidity: “);
Serial.print(humd, 1);
Serial.print(“%\r\n”);
Serial.println();
File dataFile = SD.open(“datalog.txt”, FILE_WRITE);
// if the file is available, write to it:
if (dataFile) {
dataFile.println(time);
dataFile.println(temp);
dataFile.println(fahrenheit);
dataFile.println(humd);
dataFile.close();
}
// if the file isn’t open, pop up an error:
else {
Serial.println(“error opening datalog.txt”);
}
time ++;
delay(1000);
}
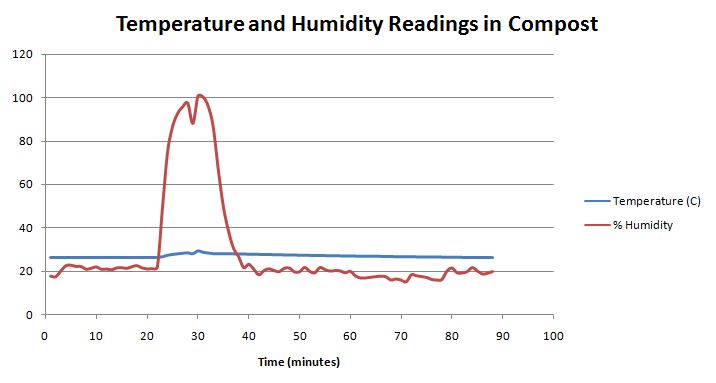
SD Card Readout Example
Here we have an example graph of collected data, followed by a table of the logged data.
|
Time (minutes) |
Temperature C | Temperature F | % Humidity |
| 1 | 26.31 | 79.35 | 17.95 |
| 2 | 26.31 | 79.35 | 17.66 |
| 3 | 26.31 | 79.35 | 20.28 |
| 4 | 26.31 | 79.35 | 22.72 |
| 5 | 26.32 | 79.37 | 22.97 |
| 6 | 26.32 | 79.37 | 22.4 |
| 7 | 26.32 | 79.37 | 22.36 |
| 8 | 26.31 | 79.35 | 21.14 |
| 9 | 26.31 | 79.35 | 21.59 |
| 10 | 26.31 | 79.35 | 22.17 |
| 11 | 26.31 | 79.35 | 21.1 |
| 12 | 26.32 | 79.37 | 21.21 |
| 13 | 26.3 | 79.33 | 20.89 |
| 14 | 26.31 | 79.35 | 21.73 |
| 15 | 26.31 | 79.35 | 21.79 |
| 16 | 26.31 | 79.35 | 21.53 |
| 17 | 26.31 | 79.35 | 22.27 |
| 18 | 26.31 | 79.35 | 22.76 |
| 19 | 26.32 | 79.37 | 21.7 |
| 20 | 26.31 | 79.35 | 21.24 |
| 21 | 26.31 | 79.35 | 21.32 |
| 22 | 26.34 | 79.41 | 22.04 |
| 23 | 26.70 | 80.06 | 48.9 |
| 24 | 27.43 | 81.38 | 74.57 |
| 25 | 27.82 | 82.07 | 86.67 |
| 26 | 28.11 | 82.59 | 92.77 |
| 27 | 28.38 | 83.08 | 95.88 |
| 28 | 28.59 | 83.46 | 97.5 |
| 29 | 28.15 | 82.67 | 88.17 |
| 30 | 29.53 | 85.16 | 100.77 |
| 31 | 28.87 | 83.96 | 100.36 |
| 32 | 28.50 | 83.31 | 96.26 |
| 33 | 28.21 | 82.79 | 86.56 |
| 34 | 28.13 | 82.63 | 66.93 |
| 35 | 28.14 | 82.65 | 50.01 |
| 36 | 28.11 | 82.59 | 38.75 |
| 37 | 28.10 | 82.57 | 30.75 |
| 38 | 28.03 | 82.46 | 26.97 |
| 39 | 28.00 | 82.4 | 21.86 |
| 40 | 27.94 | 82.29 | 23.4 |
| 41 | 27.88 | 82.19 | 21.09 |
| 42 | 27.85 | 82.13 | 18.54 |
| 43 | 27.80 | 82.03 | 20.5 |
| 44 | 27.74 | 81.94 | 21.31 |
| 45 | 27.70 | 81.86 | 20.49 |
| 46 | 27.66 | 81.78 | 19.99 |
| 47 | 27.57 | 81.63 | 21.55 |
| 48 | 27.52 | 81.53 | 21.68 |
| 49 | 27.50 | 81.49 | 19.89 |
| 50 | 27.46 | 81.44 | 19.92 |
| 51 | 27.40 | 81.32 | 21.98 |
| 52 | 27.37 | 81.26 | 20.15 |
| 53 | 27.34 | 81.2 | 19.47 |
| 54 | 27.26 | 81.07 | 21.89 |
| 55 | 27.24 | 81.03 | 20.96 |
| 56 | 27.21 | 80.97 | 20.27 |
| 57 | 27.16 | 80.9 | 20.53 |
| 58 | 27.11 | 80.8 | 20.36 |
| 59 | 27.08 | 80.74 | 19.51 |
| 60 | 27.05 | 80.68 | 20.15 |
| 61 | 27.00 | 80.61 | 18.02 |
| 62 | 26.97 | 80.55 | 17.07 |
| 63 | 26.95 | 80.51 | 17.15 |
| 64 | 26.93 | 80.47 | 17.42 |
| 65 | 26.9 | 80.41 | 17.71 |
| 66 | 26.86 | 80.35 | 17.95 |
| 67 | 26.81 | 80.26 | 17.66 |
| 68 | 26.77 | 80.18 | 16.15 |
| 69 | 26.73 | 80.12 | 16.65 |
| 70 | 26.72 | 80.1 | 16.12 |
| 71 | 26.67 | 80.01 | 15.35 |
| 72 | 26.65 | 79.97 | 18.56 |
| 73 | 26.63 | 79.93 | 18.13 |
| 74 | 26.61 | 79.89 | 17.74 |
| 75 | 26.58 | 79.85 | 17.34 |
| 76 | 26.56 | 79.81 | 16.42 |
| 77 | 26.53 | 79.76 | 16.16 |
| 78 | 26.51 | 79.72 | 16.37 |
| 79 | 26.48 | 79.66 | 20.23 |
| 80 | 26.46 | 79.62 | 21.68 |
| 81 | 26.42 | 79.56 | 19.49 |
| 82 | 26.39 | 79.51 | 19.42 |
| 83 | 26.36 | 79.45 | 20.01 |
| 84 | 26.33 | 79.39 | 21.87 |
| 85 | 26.32 | 79.37 | 20.33 |
| 86 | 26.31 | 79.35 | 18.96 |
| 87 | 26.26 | 79.27 | 19.3 |
| 88 | 26.25 | 79.25 | 20.08 |
Code (Temperature and Humidity sensors only)
/*
HTU21D Humidity Sensor
Open serial monitor at 9600 baud to see readings. Errors 998 if no sensor is detected. Error 999 if CRC is bad.
Hardware Connections (Breakoutboard to Arduino):
-VCC = 3.3V
-GND = GND
-SDA = A4
-SCL = A5
*/
#include <Wire.h>
#include “HTU21D.h”
HTU21D myHumidity;
void setup()
{
Serial.begin(9600);
Serial.println(“HTU21D Reading START”);
myHumidity.begin();
}
void loop()
{
float humd = myHumidity.readHumidity();
float temp = myHumidity.readTemperature();
//USE ONE OF THE FOLLOWING LINES TO CALIBRATE THE TEMPERATURE
//temp += __
//temp -= __
Serial.print(“Time: “);
Serial.print(millis());
Serial.print(“\r\nTemperature: \r\n Celsius: “);
Serial.print(temp, 1);
Serial.print(“C”);
float fahrenheit = ((temp * 9)/5 +32);
Serial.print(“\r\n Fahrenheit: “);
Serial.print(fahrenheit, 1);
Serial.print(“F\r\n”);
Serial.print(“Humidity: “);
Serial.print(humd, 1);
Serial.print(“%\r\n”);
Serial.println();
delay(1000);
}