DIY Photogate Tutorial
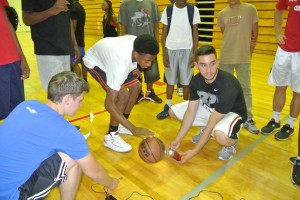
The purpose of this project is to develop a DIY photogate for measuring rates of movement. The gate is created to tie the engineering design process and scientific inquiry to the intrinsic motivation of players and fans to improve their understanding of the game. A photogate is simply a beam of light interrupted by moving feet, dribbling a ball or other movement. The rate of interruption can be used for biomechanics measurement, and constructing this is an engaging way to help students learn STEM through design and scientific inquiry.
The DIY photogate graphing tool is an application that allows the user to see and operate on the real-time graph base on the data output by the Arduino board. The purpose of this software is to measure the rates of movements.
1. Operating Principle
The output of the Arduino board is the value of the photoresistor, which is connected as following:
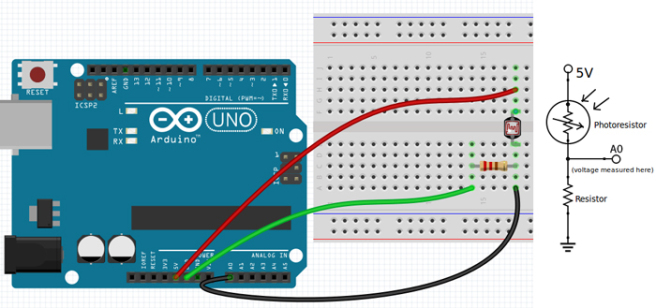
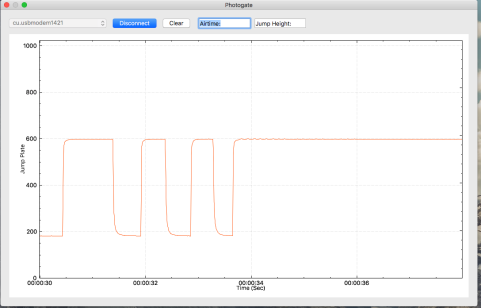
When the beam light shines of the laser pointer to the photoresistor, its value will change accordingly. At the beginning, the user is supposed to stand in between the laser pointer and the board, using its body to shade the beam from the resistor, and keep the value of the photoresistor at a steady low level. When the user jumps, the beam of the laser pointer will shine on the photoresistor, causing its value to stay at a steady high level. The jump height is thus calculated with the physics formula S = 1/2 * g * t^2, where s is the height, g is the gravity and t is the airtime. Air resistance is ignored in the calculation.
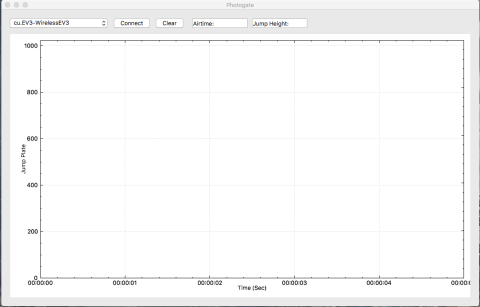
2. Graphical User Interface
Before connected to the Arduino Uno board:
When there is no beam shining on the photoresistor:
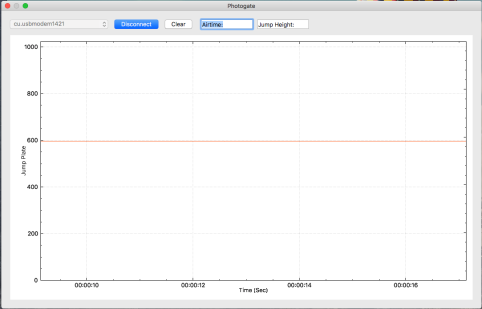
When the beam is shined on the photoresistor:
3. How to Use the Software
Step1: Connect the Arduino Uno board on to your computer via USB port.
Step2: Standalone applications: click the download link below for Mac or Windows, unzip the software. Double click on
the file called "final". Once the software launches, click on the dropdown menu and choose the proper port.
(For Mac users, please choose cu.usbmodem1421, and for Windows users, before you choose the port,
please open device manager, click on the “Port” dropdown mane and check the port. Usually COMx, where x varies
depending on your computer)
Step 2a: Browser based application: download the Node Arduino software below (windows), double click on the file to install, then navigate to the installed files for the browser application.
Step3 (Standalone): Click on “Connect”, and the software will automatically draw the real-time graph for you.
Tip: If you would like to stop the graphing process, simply click on the “disconnect” button.
4. Download Link:
Standalone application
Browser based application
Node Arduino version for Windows
Software for the Arduino
Experiments and Testing
DIY Photogate reports the number of steps users take as well as the average height of their step over the duration of the simulation. Using a timer, we encourage students to measure their cadence (foot strike rate) and their vertical oscillation in order to improve their running form.
According to Wareable - a website that breaks down different quantifiable data that sports enthusiasts use to track their progress - cadence, vertical oscillation, and contact ground time are three of many quantities that runners can measure to improve their form, increase their efficiency, and prevent injury due to imbalances.
Cadence - also known as foot strike rate - measures the rate at which a runner's foot makes contact with the ground within a certain time frame. The equation for calculating cadence is (# of strikes)/minute (SPM). Typical cadence ranges between 150 -200 STM with an ideal efficiency identified at 180 SPM. In order to achieve this, some runners incorporate music to help set their pace.
Vertical oscillation measures the degree to which 'bounce' affects running. This bounce is tracked from a fixed point on your body while you run and is closely linked to cadence. As your vertical oscillation increases, so does your foot strike rate. Typical ranges for vertical oscillation range between 6 and 13 cm, however, the lower the value the better. Efficiency is gained at lower values as less energy is wasted.
Application
By minimizing vertical oscillation and focusing on cadence, runners can improve their form and energy can be conserved.
Energy equations
- KE = 1/2 mv^2
- PE = mgh
Future Implementations
Contact ground time measures the amount of time that a runner’s foot is on the floor rather than in the air. With ranges from 160-300 milliseconds, the ideal contact ground time was found to be 190 milliseconds. This could be an interesting addition to the photogate project.
References